
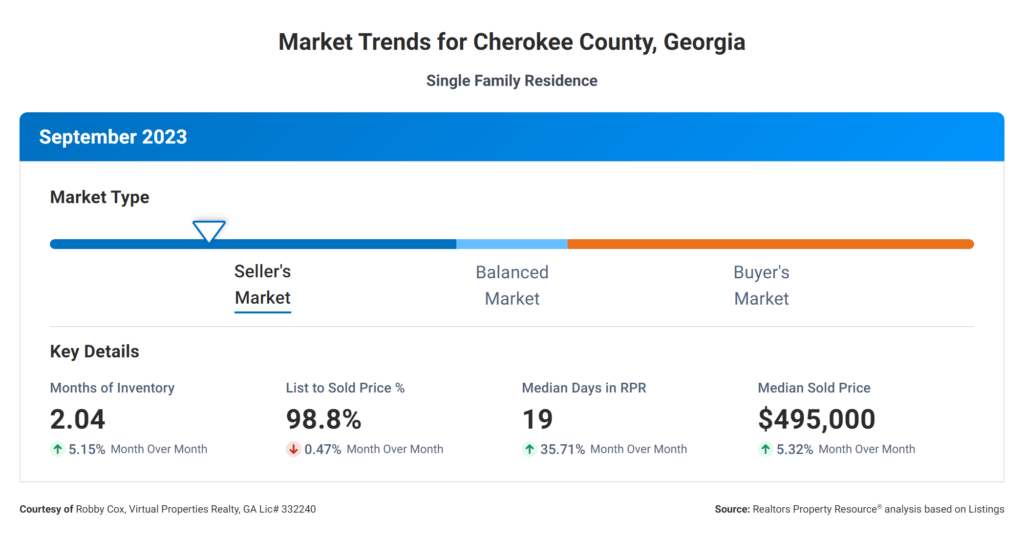
Today we will look at the Cherokee County GA real estate market update for September.. For both buyers and sellers, understanding these metrics is crucial in making informed decisions. So, let’s dive right in!
Months Supply of Inventory
First, let’s talk about the “Months Supply of Inventory,” which currently stands at 2.04. This metric represents the number of months it would take to sell the current inventory of homes on the market, assuming no new listings are added. A lower number indicates a seller’s market, where demand outweighs supply. In our case, a 2.04-month supply suggests a relatively tight market, giving sellers an advantage.
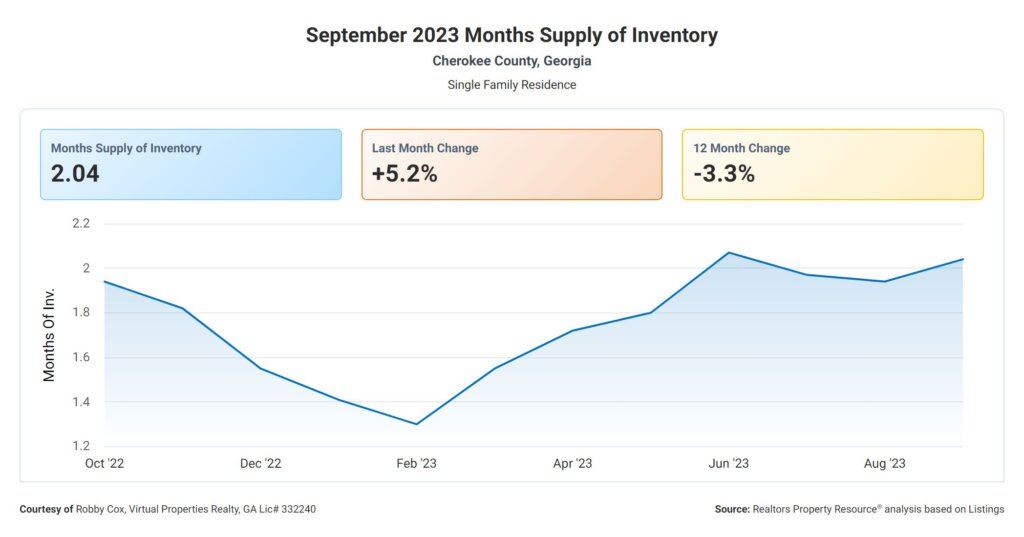
12-Month Change in Months of Inventory
Now, let’s look at the “12-Month Change in Months of Inventory,” which has experienced a decrease of -3.32%. This metric highlights the change in the supply of homes over the past year. The negative percentage indicates a reduction in the number of months it would take to sell all the homes available. This trend signifies a tightening market, potentially leading to increased competition among buyers.
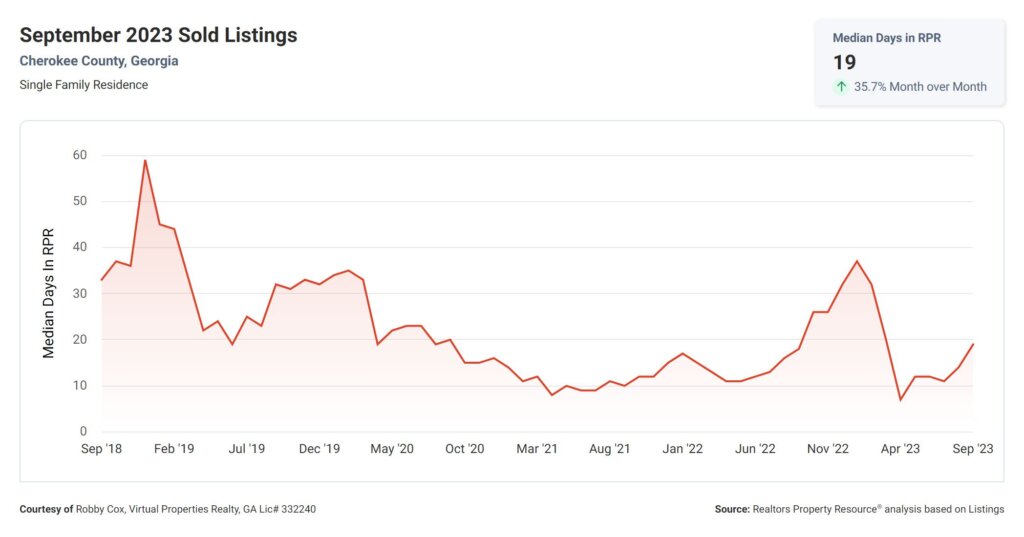
Median Days Homes are On the Market
Moving on, we have the “Median Days Homes are On the Market,” which currently stands at 19. This metric measures the average number of days it takes for a home to sell. A lower number suggests a fast-paced market, where homes are in high demand and tend to sell quickly. With a median of 19 days, it is evident that homes in this market are being snatched up swiftly.
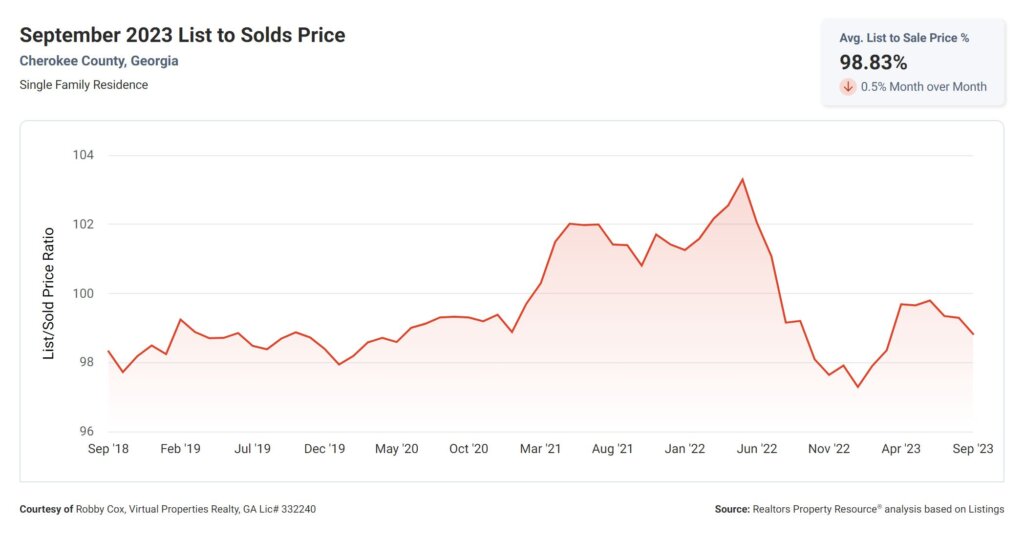
List to Sold Price Percentage
Next up is the “List to Sold Price Percentage,” which sits at an impressive 98.8%. This metric reveals the percentage of the original listing price that homes are actually sold for. A higher percentage indicates stronger negotiation power for sellers, as they are getting close to their asking price. In this market, sellers can expect to receive nearly 99% of their initial listing price, showcasing a robust market.
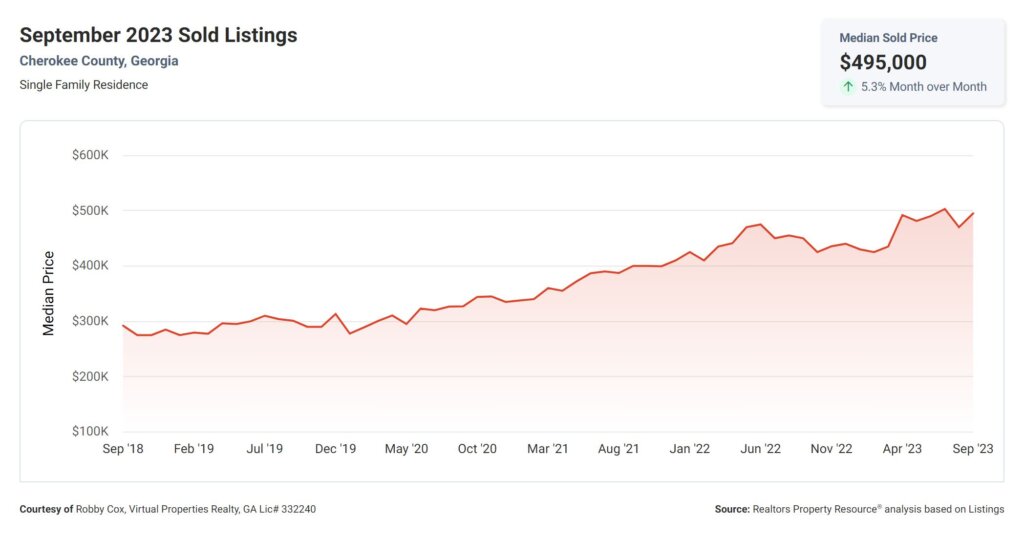
Median Sold Price
Lastly, we have the “Median Sold Price,” which stands at $495,000. This metric represents the middle point of all the sold prices in a given period. It provides a snapshot of the current pricing trend in the market. With a median sold price of $495,000, it indicates that the market is thriving, attracting buyers who are willing to invest in properties at this price point.
In conclusion, these real estate metrics paint a picture of a vibrant and active market. The low Months Supply of Inventory, decreasing 12-Month Change in Months of Inventory, and low Median Days Homes are On the Market all indicate a market that favors sellers. Additionally, the high List to Sold Price Percentage and healthy Median Sold Price further reinforce the strength of this market.
For buyers, these metrics suggest a competitive environment where homes are in high demand and tend to sell quickly. It may be wise to act swiftly when finding a property of interest.
For sellers, these metrics indicate that now may be an opportune time to list your property. With the market favoring sellers, you have the potential to receive close to your asking price and benefit from a relatively quick sale.
Remember, understanding these metrics is just the first step. It is crucial to work with a knowledgeable real estate professional who can provide personalized guidance based on your specific needs and goals. Happy buying and selling!